


The Wellness System
So, in college I was fit because I walked a lot. Then I began working and slowly gained weight. After life threw me a curveball, I started gaining a lot. I didn't know how to stop, but I ate for comfort and before I knew it I was 260lbs. I felt trapped like I was a prisoner in my own body.
Has this ever happened to you?
Do you want to learn more about this new way to seek wellness? This is a quick overview.
Do you want to engage with this system fully? If so, download the Worksheet from Google.
By opening/downloading you agree to our Legal Disclaimer.
Get Ready for The Wellness System
For the first time in human history, we have the entire world at our fingertips. We live in a fast-paced, sedentary society where the phone steals our attention. This results in less mobility and contributes to obesity and overweight. According to the WHO, obesity has already reached epidemic proportions globally. Even more alarming is the rise of childhood obesity which is already epidemic in some areas and on the rise in others.
The purpose of The Wellness System is to battle the obesity epidemic head-on by using applied mathematics. By creating mathematical structures and portioning them out in the form of food, you can gain control of your eating habits and therefore are able to more clearly set goals and build strategies to attain wellness in all areas of your life.
General Information
The Wellness System is a form of holistic health. The purpose of The Wellness System is to aid in the pursuit of wellness through math. Everyone is a unique individual and will have a different strategy. Using spreadsheets to organize information interprets that information into meaningful analysis, and helps you to create lasting change in your habits. The system is not automated and requires physical effort, however, this is a good thing because you will learn about your habits and how to discover your own strategy. There are a few things you will need to get started with The Wellness System:
- A desktop or laptop computer. You will be copying and pasting formulas and this doesn't work as well on cellphones. You can still use a phone, but it will be slower. If you don't have anything, I recommend getting an inexpensive Chromebook by Google. This will also give you access to Sheets for free
- The Wellness System Worksheet
- A spreadsheet application that can open *.xlsx files (I use Google Sheets)
- A calculator (I use Desmos.com/scientific)
- A grocery store close by
- A food scale to measure your portions
- Your BMR or how many Calories you burn in a day without exercise (you will need this info to help calculate your Calorie deficit). You can find websites that estimate your BMR.
- Knowledge of basic arithmetic and spreadsheet formulas
- Time. You must find time to create structures. You will get out of this system what you put into it
- Patience and perseverance. TWS is about making a long-term commitment to achieving wellness in your body, mind, and spirit
This system is based on resources (food or drink consumables). These are the axioms, the basic building blocks that you will use to create structures. A structure is a set of resources organized in a meaningful way. By studying the structures that you make, you may begin to observe patterns in your habits, and thus make modifications.
Compatability Notes
The Wellness System uses spreadsheets in order to help you organize your strategy. The system worksheet is contained in a *.xlsx file and can be opened in Google Sheets, Microsoft Excel, and most other spreadsheet programs. For those who do not have spreadsheet software, a free Google account will give you access to Sheets. There are some compatibility issues between Sheets and Excel:
- Colors don't match
- Ghost lines
- Functions don't always map the same
The Wellness System is very simple and only uses basic arithmetic. Even still, you need to use the correct function in order to be compatible with both applications:
- Addition
- =SUM(A,B)
- Subtraction
- =A-B
- Multiplication
- =PRODUCT(A,B)
- Division
- =A/B
This will ensure that your system worksheet will be cross-compatible.
Be careful when switching between Sheets and Excel. The coloration will be lost when you open the file in Excel and again in Sheets.
Also, most of the images will be too small to see as is. All you have to do is alt click or right click and select 'open image in new tab' and you will be able to see the numbers.
Interpreting the System Worksheet
Resources Integration
In TWS, all quantities are measured in grams. This tab is a reference for converting cups, ounces, and fluid ounces into tempered or exact grams. It is separated into two charts, the first is for dry goods, the second for aqueous substances.
The Resources Map
This is the main resources reference sorted by nutritional value and/or energy value. Use this to help you decide what to consume.
The Personal Resources Map
This reference is your personal resources map sorted by nutritional value and/or energy value. Use this to import resources.
Expression Types and Resource Behavior
This tab is a reference for resource classification and interaction. Learning how to put certain resources together will help you balance your composites.
The Definition Library
Use this tab to create nested resources for reuse.
The Archive
Use this tab to store the structures you build. Once you accumulate structures, you can search them for reference. The archive has templates at the top for you to copy and paste. You should never have to build a structure from scratch. Just copy and paste the template (or other structure) you want and restructure it with new resources.
The Whiteboard
This is where the fun happens. Use this tab to build structures that match your personal needs.
Extensions
An extension is a way of enhancing TWS by adding additional, measurable parameters to the defaults. An example would be a Caffeine Content extension.
Structures
Structures are what give The Wellness System meaning. By creating structures, you are able to organize and understand information with regard to your habits. There are 6 types of structures and each serves a purpose and bears a mathematical underpinning.
- The Resource - the most basic structure, used as a building block
- The List - the simplest multi-resource structure, used for resource access or analysis
- The Formation - the structure intended for tracking
- The Definition - the structure used to nest resources and save space
- The Grid - the structure used for daily tracking and grazing
- The Map - a double list structure organized by W and E used for resource reference and importation
Structures also have a behavior that allows us to analyze them in an organic manner. We can analyze lists and make generalizations about their contents. We can analyze formations which allows us to balance the composite. We can analyze grids which helps us to understand daily habits. We can analyze maps that tell us the nature of its resources.
The Resource Structure
"Resource" is a convenient way of saying "food" or "drink". It is also the simplest, lowest-level structure in TWS. If the system is your body, the cell is a resource. Even though it can be divided into pieces, the resource is considered to be fundamental. The resource is an axiom. It is considered to be true since it is made of basic parts. The parts of a resource are:
- Designation - the name of the resource
- Components - the amounts of mass, Calories, fiber, and protein
- Expression - the 4 metrics derived from the relationships between the components
A resource looks like this:

Resources are generally not accompanied by a header row, because they are never seen out of the context of a higher structure. However, for the sake of clarity, this graphic shows you the header information.
The List Structure
The list is a structure used for grouping resources and analysis. It is the simplest way to piece resources together and create a form of analysis through sorting. A list can reveal which resources are better with certain parameters. For example, a map sorts according to the W and the E. A list is most commonly used to group resources together. It is also used to create studies and proofs. The parts of a list are:
- Header - designation (named or unnamed) and list parameters
- Collection - a group of resources
- Sort (optional) - parameter used for organizing the list
This is what a list looks like:
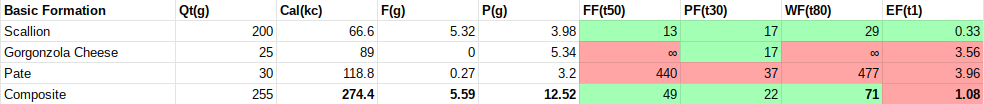
The Formation Structure
The formation is a structure designed for tracking. It is similar to the list, however it has a row at the bottom called the “composite” that is an aggregate of the list above. A formation tells you the estimated overall impact a group of resources has. It also serves as a form of analysis. If your composite is unbalanced, you should go back and analyze the collection, fixing problems until the composite is balanced. The parts of a basic formation are:
- Header - designation (named or unnamed) and formation parameters
- Collection - a group of resources
- Composite - a row used for aggregating the collection and analysis
A formation is generally not sorted. This is what a basic formation looks like:
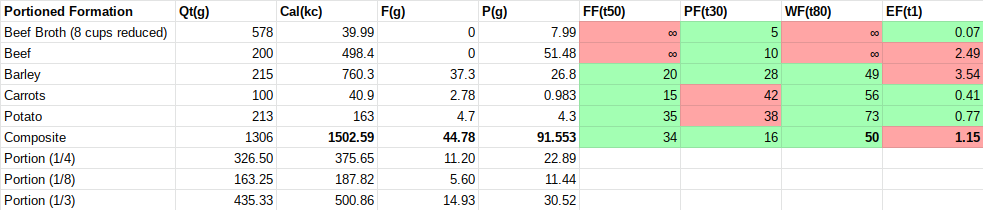
There are two other types of formations that are used for portioning and meal planning. A portioned formation has any number of “tags” that apply a factor to the formation’s composite. This is useful for portioning a recipe like cookies. The parts of a portioned formation are:
- Header - designation (named or unnamed) and formation parameters
- Collection - a group of resources
- Tags - any number of factors applied to the composite (usually scale down). They live right under the composite.
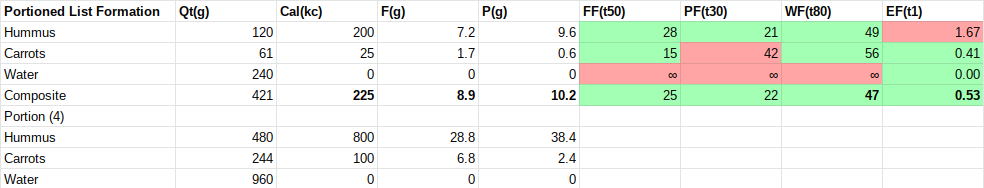
Second, a portioned list formation is a formation with a repeated set of components. The components are copied under the composite and the factor is applied to each component. This is useful in portioning for multiple people. The parts of a portioned list formation are:
- Header - designation (named or unnamed) and formation parameters
- Collection - a group of resources
- Composite - a row used for aggregating the collection and analysis
- Portion Row - a row that declares the portion amount
- Portioned Components - the components that have been multiplied by the portion amount
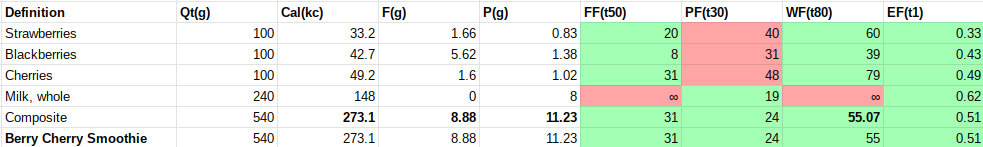
The Definition Structure
The definition is designed for nested resources and reuse. If you find yourself copying and pasting large numbers of the same resources, creating a definition makes sense to save space and effort. The parts of a definition are:
- Header - designation (named or unnamed) and definition parameters
- Collection - a group of resources
- Composite - a row used for aggregating the collection and analysis
- Seed - a row designed for copying and pasting into other structures
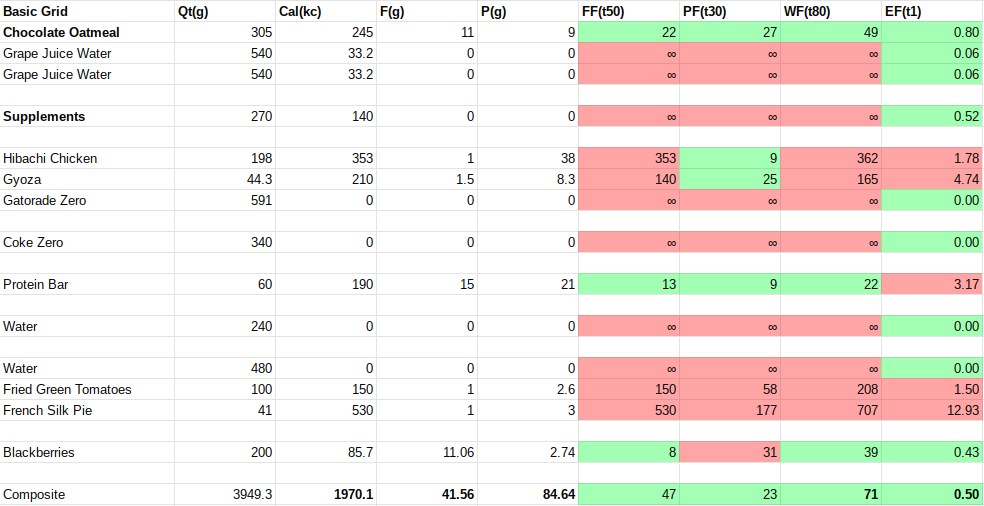
The Grid Structure
The grid is a structure designed for tracking daily resources. It also simplifies the composite by aggregating the whole day into one global composite; formations, on the other hand, must be tallied in order to determine the global composite. Also, the grid has spaces between resources and resource groups signifying the passage of time. Therefore, it helps you analyze your habits by being organized chronologically. The parts of a grid are:
- Header - designation (named or unnamed) and grid parameters
- Collection - a group of resources, resource groups, and spaces (sorted chronologically)
- Composite - a row used for aggregating the collection and analysis
- Seed - a row designed for copying and pasting into other structures
This is what a grid looks like:
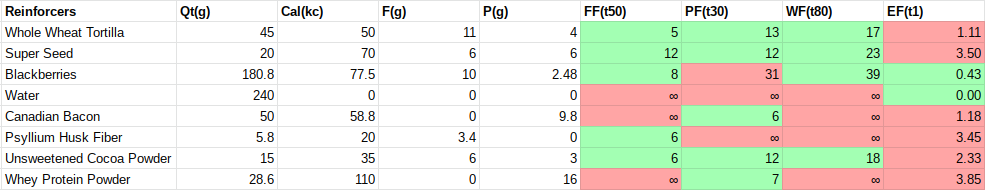
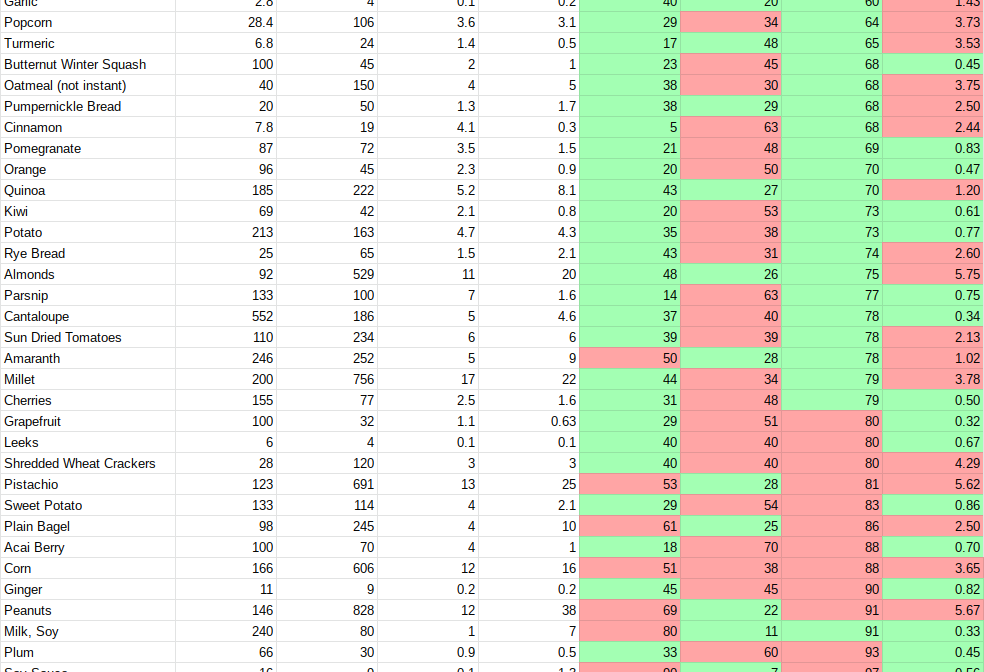
The Map Structure
The map is the largest-scale structure, organized as a double list. The first is sorted by W and the second by E. The map is designed for reference. Those at the top are complete because they do not have division by zero. Those at the bottom are incomplete because they have natural division by zero. One list isn’t better than the other. We need complete resources and we need incomplete resources. The parts of a map are:
- Header - designation (named or unnamed) and map parameters
- Collection 1 - a group of resources organized by W
- Collection 2 - a group of resources organized by E
The resources map is designed to be read-only which means you can copy but you can’t modify. The personal resources map is designed to be modifiable.
This is what a map looks like:
The Expression (Metrics) of a Resource
The expression and Metrics are at the heart of TWS. In fact, I created metrics first and then went back and uncovered the math behind it. The expression is the behavior of a resource. If the components are like the DNA of a resource, the expression is the physical manifestation. It is composed of 4 factors that are derived from formulas taken from the relationships between various components.
How do you determine the factors for a resource? You can use the following formulas to do so. In your system worksheet, make sure the expression is an actual formula instead of just a static number. Once you do this once, you should be able to reuse it for all other resources.
The Fiber Metric
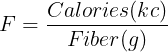
By dividing the number of Calories by the amount of fiber, you will obtain a number that will help determine the overall fiber value of the resource. You can use this number when trying to decide between closely related resources. This is used to maximize fiber and minimize Calories. For example:
The F for 1 Nutrition Bar is 220 Cal/14g Fiber: 220/14 = 15.7F
This bar would be considered an overall great source of fiber value; anything less than 50F is an overall good choice. We can also tell how this nutrition bar compares to other bars in the grocery store, so you can get the bar with the highest fiber value. If there are no Calories, the F bottoms out at zero, and if there is no fiber, it is undefined.
The Protein Metric
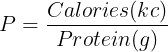
By dividing the number of Calories by the amount of protein, you will obtain a number that will help determine the overall protein value of the resource. You can use this number when trying to decide between closely related resources. This is used to maximize protein and minimize Calories. For example:
The P for 1 Nutrition Bar is 220 Cal/13g Protein: 220/13 = 16.9P
This bar would be considered an overall great source of protein value; anything less than 30P is an overall good choice. We can also tell how this nutrition bar compares to other bars in the grocery store, so you can get the bar with the highest protein value. If there are no Calories, P bottoms out at zero, and if there is no protein, it is undefined.
The Wholeness Metric

By aggregating the F and P, you will obtain a number that will help determine the overall wholeness and nutritional value of the resource. You can use this number when trying to decide between closely related resources. This can also be used to maximize overall value and minimize nutritional incompleteness. For example:
The W for 1 Nutrition Bar is: 15.7F + 16.9P = 32.6W
This bar would be considered an overall great source of wholeness; anything less than 80W is an overall good choice. We can also tell how this nutrition bar compares to other bars in the grocery store, so you can get the bar with the highest overall nutritional wholeness. If either F or P are undefined, the W is also undefined.
The Energy Metric
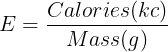
By dividing the number of Calories by the amount of mass or quantity, you will obtain a number that will help determine the overall energy density of the resource. You can use this number when trying to decide between closely related resources. This is used to minimize high-Calorie foods or balance them out by pairing them with low-Calorie foods. For example:
The E for 1 Nutrition Bar is 100 Cal/25g: 100/25 = 4E
This bar would be considered too energetic to be eaten by itself; anything less than 1E is an overall good choice. We can also tell how this nutrition bar compares to other bars in the grocery store, so you can get the bar with the lowest energy density. If there are no Calories, the E bottoms out at zero, and if there is no quantity, it is undefined.
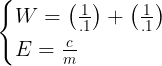
There are five main considerations to E, namely protein, sugar, oil, alcohol, and mass. These variables give you a formula for a quick estimation of E.


The way to read and understand this expression is as follows:
E = energy value, p = protein, s = sugar, o = oils, a = alcohol, m = mass
When E is low, p, s, f, and a also tend to be low, except for m which tends to be high. On the other hand, when E is high, p, s, f, and a tend to be high, except for m which tends to be low. That means that people who have high energy value eat small amounts of protein, sugar, fat, alcohol, and large amounts of mass like water. Similarly, people who have a low energy value eat large amounts of protein, sugar, fat, alcohol, and small amounts of mass like water.
You can see all 4 metrics in the figure below. A metric is either green or red depending on whether it meets the defined threshold. Metrics use thresholds instead of ranges. TWS thresholds are all inversely proportional. This means that lower numbers have higher values. You can see below that the first 3 metrics are below threshold and the last is not:

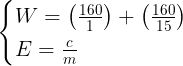
The Metrics Become The Wellness Formula
Using the four metrics above, we can blend them together into a system of literal equations. This system of equations is called The Wellness Formula and is at the fundamental core of each resource. Each resource has 4 components which are just inputs fed into the system. But once that happens, the system comes alive. Mathematically, the system emerges from the metrics:
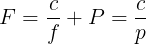
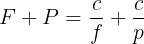
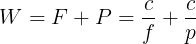
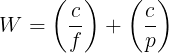
In the first line, we see the basic relationships between the amounts of fiber, protein, and Calories. Then we add both of those equations together to understand the relationship between the first two metrics. The third equation defines W as a higher order metric, or rather a metric made of metrics. To simplify all this information, it is written in a straight-forward, user-friendly form.
The second equation in the formula, which is also the fourth metric, is already in simplest form:

Then we can group these simple equations together as a system:

This formula defines the operations that are performed on the components of each resource and is therefore responsible for the values of each metric. W tells us about the nutritional information of the resource, and E tells us about the leanness and energy density. Each equation operates independently from one another but says something unique about the resource in question.
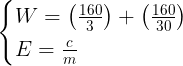
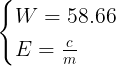
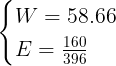
Let’s do a very simple example of using The Wellness Formula:
Using the components f, p, and c, fill in the variables and solve for W:
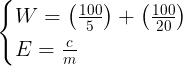
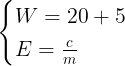

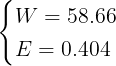
Using the remainder of the components (m), solve for E:


Now we have a solution to each equation in the Wellness formula. Even though this resource doesn’t exist, we can still infer information about it for example, this imaginary resource is complete (has a solution for both sub-equations), it is very high in nutrition, and has an elevated E which indicates the presence energy. Since this doesn’t normally happen for a singular resource in nature, we can conclude that this must be a sandwich or a salad.
The Threshold Formula
Part of the basics of The Wellness System is the usage of thresholds and non-linear functions. It uses thresholds as a means of expressing desirable or undesirable behavior. One metric that is above a threshold is not a problem, however when every resource in your formation is red, that’s a clear indicator that you need to rethink your meal.
When working in your worksheet, it can be overwhelming with all the numbers flying around. So, I created the threshold formula to help you visualize the properties and the metrics of a resource. The Threshold formula is an auxiliary system of equations, part of The Wellness System, designed to help you make sense of all the data you are working with.
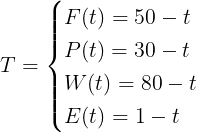
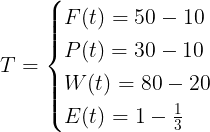
In each equation, the variable t represents a corresponding metric’s value. Also, every initial number is the threshold for that particular metric. Here is an example of reducing the threshold formula:
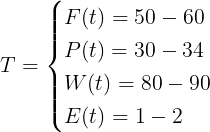
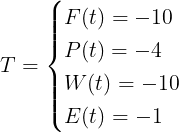
As you can see, this resource is undesirable. It is over threshold in every single metric, even though not by much. However, mixing it with a more desirable resource could make it more desirable.
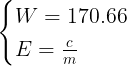
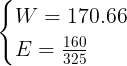
Lets try out using the Wellness formula and the threshold formula with, say, bean sprouts:
First we solve for W by using the information on the nutrition label (c, f, p):

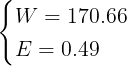
Next E. We solve for E by using the nutrition label as well (c, m):

Now we determine the threshold factors:
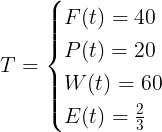
Initially, W and E have to be solved before we can begin to make inferences about the sprouts. After W and E are solved, we can begin to determine the threshold factors. First, we plugin the values for each t according to each threshold. Second, we solve for each equation and determine the threshold factor for each metric. This gives us a lot of detail about each metric instantly, i.e. all the metrics are under threshold (all positive), W has the highest score, this resource has twice as much fiber value as protein value, etc.
Comparative Analysis
You don’t have to apply both equations or use the threshold formula in order to make inferences about the component information. For example, you can use W to compare canned goods at the grocery store. Or you can use E to uncover which meat is leaner. But for example, we are going to perform a complete comparative analysis on these two protein shakes.
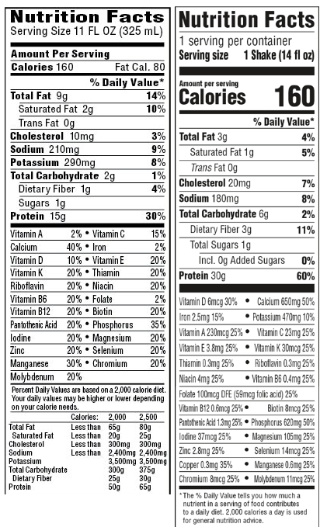
Evaluate the nutrition label on the left:
Evaluate the nutrition label on the right:
Now we can compare and analyze. I added the threshold formulas as well:
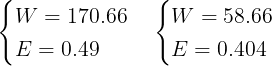
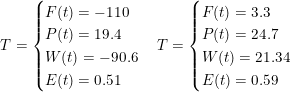
Now, this starts out a little deceptive. For any calorie counter, they would look at both and see that they both have the same number of calories. So they might think it’s a toss up and choose the one that looks more enticing. But there is useful information hidden in the label that TWS will bring out.
Looking at the Wellness formulas, the left has a high W which indicates very low nutritional value. The E is about average. The right has a lower W which indicates a higher nutritional value, and E is .4 which is about normal. Just by looking at the Wellness formulas, we can tell which is a better choice; the right one.
Just for fun, lets add the threshold formulas into the mix. Looking at the left thresholds, we can now see why the W is so high. The fiber value is 110 above threshold which pushes the W up to 90.6 above threshold. The protein value is not impressive, it’s close to threshold, and the E is normal.
When comparing resources, the difference between the two values for W will give you a gap between the value and the threshold. This is what the threshold formula measures. Secondly, the difference between the two values for E will give you a gap between the values and the threshold. You can then make an inference based on the two values.

Sometimes a component can be zero causing W to be infinite. For example, fiber is zero for meat resources. When fiber or protein is zero, the corresponding F or P is infinite. We can show that this is the case by decreasing the amount further and further towards zero and the result is a metric that grows higher and higher. So the actual metric for a zero fiber or protein amount is infinity.
This presents a challenge with W since it is the sum of F and P. If F or P is infinite, W is also infinite. For infinity plus a normal integer is infinity. Resources that have an infinite W are called incomplete and are usually sorted by the E instead of the W. This is why a map structure has two lists, one for complete resources (W is finite) and the other for incomplete resources (W is infinite).
You can still use incomplete resources for the value they contain. For example, meats are incomplete however they usually have some of the highest protein value of any resources. You don’t have to worry about division by zero in the components. A component that is zero will simply aggregate to zero.
If the number of Calories is zero and the fiber, protein, and mass are non-zero, the expression is all zeros. This rarely happens since the presence of protein has Calories. More common is when the mass is non-zero and Calories, fiber, and protein are all zero. This creates infinity in F, P, and W and zero in the E. This is the signature of water.
Here is a resource that has zero fiber and therefore an infinite F and W:

Notice how this resource still has useful information even though W is infinite; we know that E is .54 which is below threshold and that P is 5 which is way below threshold. So, even though egg whites have an infinite W, they are a fantastic choice for protein value and energy value.
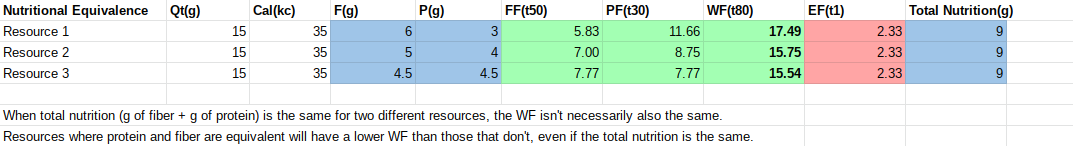
The Nutritional Equivalence Proof
This is an example of a mathematical proof. It's my favorite proof because it shows that sameness (the same amount of fiber and protein) has more value than disparity, even when the total nutrition is the same:
Legal Disclaimer
I am not a doctor or a dietitian. The information I provide is based on my own personal weight loss and nutrition journey. Any recommendations I may make about weight training, nutrition, supplements or lifestyle, or information provided to you in person, through my service, or on this website should be discussed between you and your doctor because changing your eating habits and working out involves risks. The information you receive in my emails, programs, services and products do not take the place of professional medical advice. I aim to accurately represent the information provided in my e-mails, programs, services, and products. You are acknowledging that you are participating voluntarily in using any of my e-mails, programs, services, and/or products, and you alone are solely and personally responsible for your results. You acknowledge that you take full responsibility for your health, life and well-being, as well as the health, lives and well-being of your family and children (born and unborn, as applicable), and all decisions now or in the future. Before starting any new diet and exercise program please check with your doctor and clear any exercise and/or diet changes with them before beginning. I am NOT a doctor, nutritionist or registered dietitian. I do not claim to help cure any condition or disease. I do not provide medical aid or nutrition advice for the purpose of health or disease nor do I claim to be a doctor or dietitian. Any product recommendation is not intended to diagnose, treat, cure, or prevent any disease. My statements and information have not necessarily been evaluated by the Food and Drug Administration. I expressly disclaim responsibility to any person or entity for any liability, loss, or damage caused or alleged to be caused directly or indirectly as a result of the use, application or interpretation of any material provided to you as the client. Individual results are not guaranteed and may vary. We cannot and do not guarantee that you will attain a specific or particular result, and you accept the risk that results differ for each individual. The health, fitness, and nutrition success depends on each individual’s background, dedication, desire, and motivation. As with any health-related program or service, your results may vary, and will be based on many variables, including but not limited to, your individual capacity, life experience, unique health and genetic profile, starting point, expertise, and level of commitment.